Amelia Island runs mild through winter and hot and wet through late summer. The weather station in Fernandina Beach averages a 64.3°F high in January, an 83.9°F high in May, a 90.7°F high in July, and a 72.4°F high in November. November is the driest month at 1.87 inches of rain and September the wettest at 7.19. Atlantic hurricane season runs June 1 through November 30.
On a February morning at Main Beach you'll pass people in fleece jackets and people barefoot in the surf, on the same stretch of sand, in the same hour.
Nobody's wrong. That's what a 66.6-degree afternoon does to a beach.
What is the weather like on Amelia Island, Florida, by month?
Average highs climb from 64.3 degrees in January to 90.7 in July, and monthly rain runs from 1.87 inches in November to 7.19 in September. These are the 1991 to 2020 normals from the station on the island itself rather than an inland reading. Average high, average low, average rainfall.
- January: high 64.3°F, low 45.4°F, 3.20 inches
- February: high 66.6°F, low 48.6°F, 3.13 inches
- March: high 72.2°F, low 54.1°F, 3.27 inches
- April: high 77.4°F, low 59.8°F, 3.03 inches
- May: high 83.9°F, low 67.7°F, 2.68 inches
- June: high 88.3°F, low 73.1°F, 6.12 inches
- July: high 90.7°F, low 74.9°F, 4.96 inches
- August: high 89.5°F, low 74.9°F, 6.39 inches
- September: high 86.0°F, low 73.2°F, 7.19 inches
- October: high 80.1°F, low 65.3°F, 4.97 inches
- November: high 72.4°F, low 56.1°F, 1.87 inches
- December: high 66.3°F, low 49.4°F, 3.12 inches
Read down the rainfall figures and the seasonal pattern is clear. Every month from November through May comes in under 4 inches. June through September range from 4.96 to 7.19 inches.
Now do the subtraction the list doesn't hand you, and take each low away from its high.
January gives you 18.9 degrees between the average daily high and low. August gives you 14.6.
Summer nights generally give back less of the day's heat than winter nights do. That smaller gap is worth noticing alongside the daytime number.
What does winter actually feel like here?
Mild, and shorter than most people expect.
December, January and February average highs of 66.3, 64.3 and 66.6 degrees, with 3.12, 3.20 and 3.13 inches of rain. The coldest average low on the whole calendar is January's 45.4.
An average is not a promise about any particular night. A thirty-year normal smooths over cold snaps, and the island still gets them.
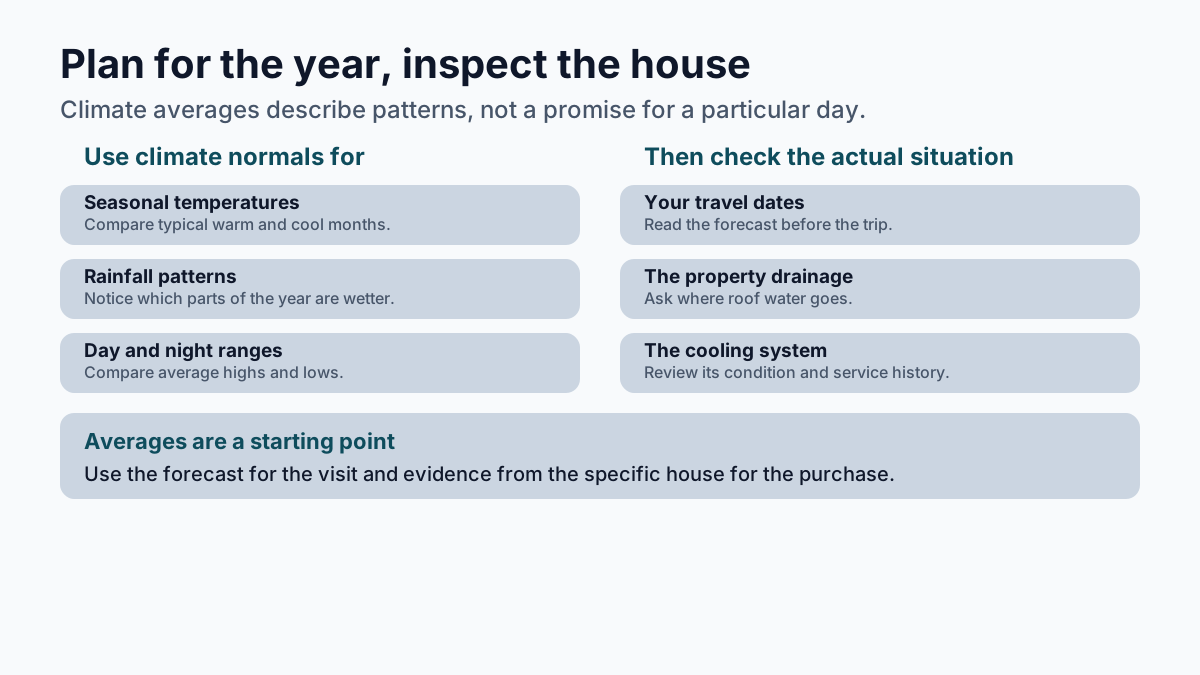
What the winter figures give you is a starting point for questions about a house. Ask about heating and cooling costs, inspect the exterior hardware, and find out how the lot sheds water throughout the year.
What is spring like on Amelia Island?
March through May is when the island warms up and the rain backs off.
March averages 72.2 degrees with 3.27 inches. April climbs to 77.4 with 3.03. May reaches 83.9 with just 2.68.
May is the driest of the spring months and the second driest on the calendar. Only November, at 1.87 inches, comes in lower.
May's average low is 67.7. Whether the ocean feels inviting is a separate question: check the water temperature and make that call for yourself.
How hot does it actually get?
July is the peak, at a 90.7-degree average high, with August at 89.5 and June at 88.3.
The lows are the honest part of summer. 73.1 in June, 74.9 in July, 74.9 in August.
The rain arrives with the heat. 6.12 inches in June, 4.96 in July, 6.39 in August.
Summer also opens the risk calendar. Hurricane season runs June 1 through November 30, and activity peaks around September 10, with most of it falling between mid-August and mid-October.
What is September like on Amelia Island?
September is the wettest month here at 7.19 inches, and it lands inside that peak window.
The temperature is still fully summer, an 86.0-degree average high over a 73.2 low.
Then the year lets go fast. October falls to 80.1 with 4.97 inches. November falls again to 72.4 with 1.87, the driest month on the list, and hurricane season closes on the 30th.
Two months, and the whole character of the place turns over.
What does the weather mean for a house here?
The wet months and the summer heat give you practical questions about a house: where the roof water goes, how the cooling holds up in August, and what condition the exterior is in.
If you first meet the island on a pleasant-season visit, take time to picture living here through the months you haven't seen.
March and November show you the island at its easiest. They don't show you what 7.19 inches in September does to a low spot in a yard, or how a fifteen-year-old air handler behaves through a week of 90.7-degree afternoons.
If you can only come once, come in the season you're least sure about, and read the numbers for the one you'll miss.
And when you're walking a property, ask the questions the wet months ask.
Where does the water go once it leaves the roof.
When was the roof last replaced, and what documentation came with it.
How did the cooling system handle last August, not last February.
What condition are the exterior hardware and finishes in after a year of salt air.
None of that is an argument against the place. It's an argument for looking at one specific house with the whole year in mind, which is most of what a good agent is actually for.
A forecast tells you what to wear this week. A climate record tells you what a house will be asked to do every year it stands.
If you're weighing a move to the island, or deciding which season to test before you commit, I'd be happy to walk you through how the different parts of it live through the year.
Frequently asked questions
What is the coldest month in Fernandina Beach, Florida?
January. [The Fernandina Beach normals](https://www.ncei.noaa.gov/access/services/data/v1?dataset=normals-monthly-1991-2020&stations=USC00082944&format=csv&includeStationName=true&units=standard&dataTypes=MLY-TMAX-NORMAL,MLY-TMIN-NORMAL,MLY-TAVG-NORMAL,MLY-PRCP-NORMAL,MLY-DUTR-NORMAL) put it at a 64.3°F average high and a 45.4°F average low, the coldest average low of the year. December runs close behind at 66.3°F and 49.4°F.
When is hurricane season on Amelia Island?
Atlantic hurricane season runs June 1 through November 30. Activity peaks around September 10, with most of it falling between mid-August and mid-October.
What is the best time of year to visit Amelia Island?
For warm days with the least rain, April and May average 3.03 and 2.68 inches alongside highs of 77.4°F and 83.9°F. November is drier still at 1.87 inches with a 72.4°F high, and it sits at the closing end of hurricane season.
What are the wettest and driest months on Amelia Island?
September is the wettest at 7.19 inches and November the driest at 1.87. Every month from November through May comes in under 4 inches, while June through September range from 4.96 to 7.19.
How much cooler do the nights get on Amelia Island?
The average daily high-low range is wider in winter than in summer. January averages 18.9 degrees between the daily high and low, and August 14.6.
Sources reviewed
- NOAA1991–2020 Fernandina monthlynormals: January
- NOAA1991–2020 Fernandina monthlynormals: February
- NOAA1991–2020 Fernandina monthlynormals: March
- NOAA1991–2020 Fernandina monthlynormals: April
- NOAA1991–2020 Fernandina monthlynormals: May
- NOAA1991–2020 Fernandina monthlynormals: June
- NOAA1991–2020 Fernandina monthlynormals: July
- NOAA1991–2020 Fernandina monthlynormals: August
- NOAA1991–2020 Fernandina monthlynormals: September
- NOAA1991–2020 Fernandina monthlynormals: October
- NOAA1991–2020 Fernandina monthlynormals: November
- NOAA1991–2020 Fernandina monthlynormals: December
- NOAA National Hurricane Center — Atlantic hurricane season dates
- NOAA National Hurricane Center — peak of Atlantic hurricane season