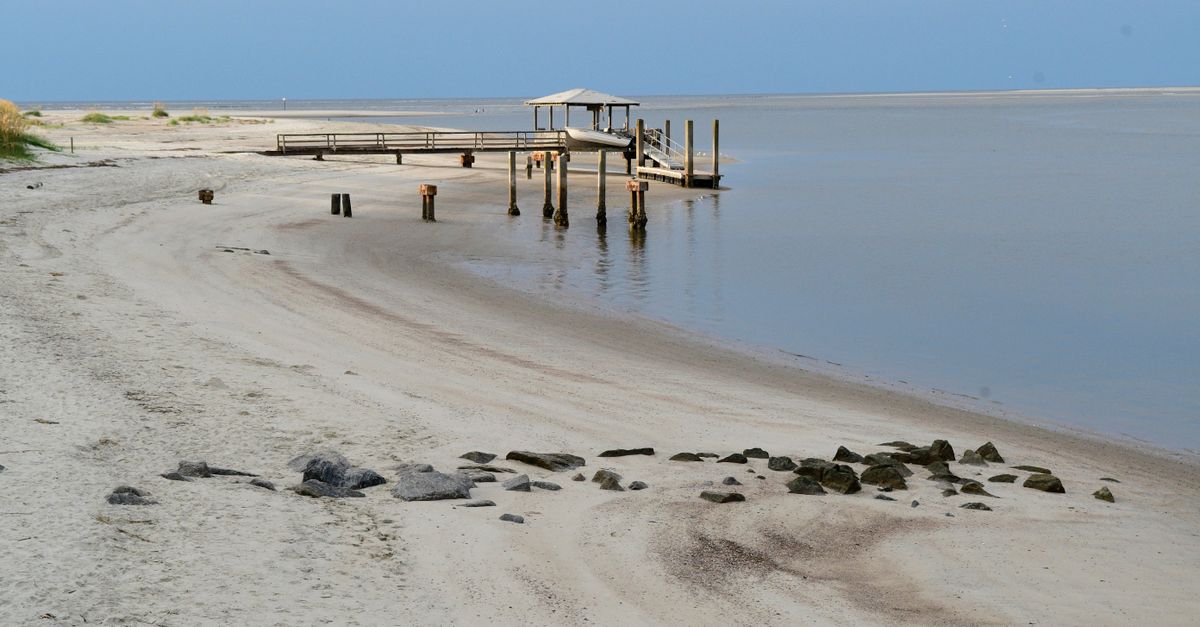
A Fernandina Beach tide chart is the published schedule of high and low water for NOAA tide station 8720030, the gauge at 30.671356, -81.46584. Read it for two things: the clock times of the day's highs and lows, and the height printed beside each one. The average swing between them at this station is 6.02 feet, which is why the hour matters as much as the day.
Six feet of water is a lot to move in and out twice a day.
At low tide, look at how much sand is exposed and whether the surface suits the walk or bike ride you planned.
At high tide, check how much room remains before setting down the chairs.
Nothing changed but the hour.
That is the practical value of the chart. It tells you which version of the day you are about to get.
What do the numbers beside each tide actually mean?
Each number on a tide chart is a height above a reference level, not a depth measured from the sand under your feet. Check which datum the chart uses. NOAA predictions commonly use Mean Lower Low Water; check the datum selected on your chart. Its separate station-datum table, accepted in April 2003 for the 1983 to 2001 epoch, puts Mean Higher High Water at 8.26 feet and Mean Lower Low Water at 1.70 feet above the station's fixed zero. Those station-datum figures should not be mistaken for prediction heights. NOAA's Mean Range of Tide is 6.02 feet, the difference between mean high water and mean low water.
Why does the range get bigger some weeks?
Because the moon and the sun pull on the ocean, and their positions keep changing.
When the Earth, sun, and moon line up nearly in a row at the full and new moon, the average tidal range runs slightly larger. About seven days later the sun and moon sit at right angles to each other and the range shrinks, with highs a little lower and lows a little higher than average. Those two patterns are called spring tides and neap tides.
On the beach, watch how that changing range affects the space you have. The chart gives you the tide; the conditions in front of you still matter.
Which hours are worth planning around?
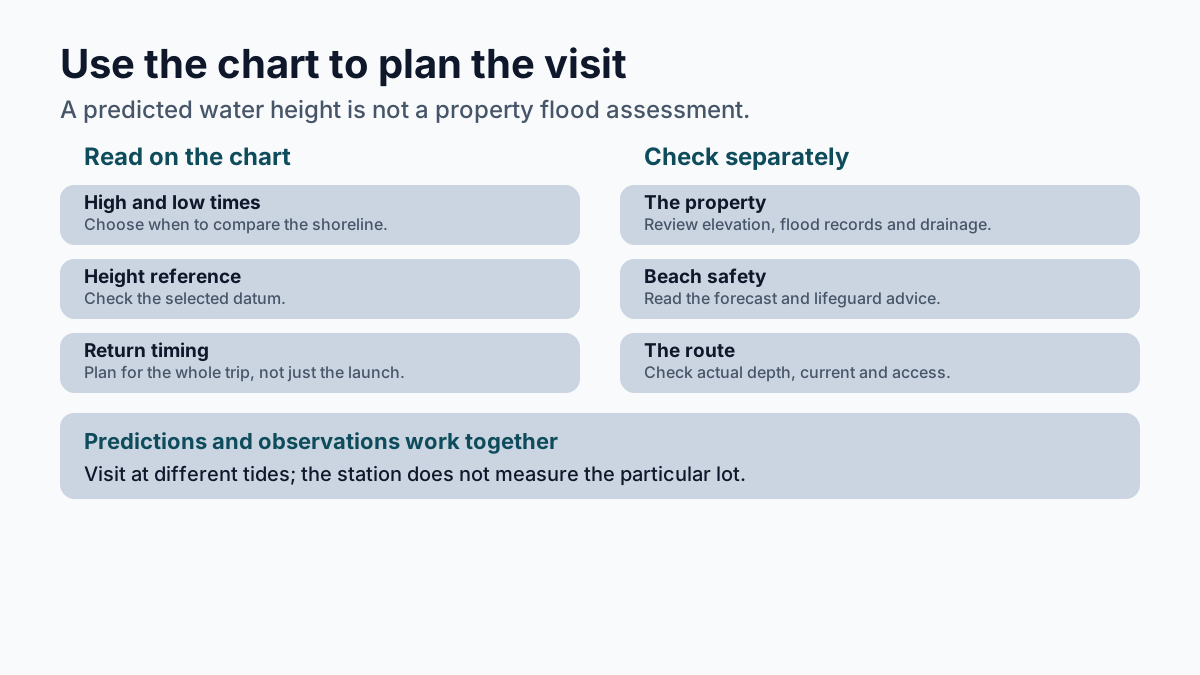
Low and high tide are useful times to compare the beach, a ramp, or a marsh creek. Once you start reading the chart, add a check of the actual conditions before making your plan.
- At low tide, check the exposed sand and any tidal pools before choosing your route.
- At high tide, check a ramp or marsh creek's usable depth and the current.
- For a boat or kayak trip, read the height beside the time and plan for the return as well as the launch.
- Ask about local conditions; a tide prediction does not guarantee a ramp or route is safe to use.
None of that takes expertise. It takes looking at the chart before you commit to an afternoon.
What can a tide chart tell a buyer about a lot, and what can't it?
The chart helps a buyer choose when to see a lot at both ends of the swing, but it can't say whether the lot floods. For anyone shopping near the water, the chart is a scheduling tool for showings.
Visit a waterfront property at both low and high tide. Look for exposed pilings, ask about usable dock depth, and see how close the water comes to the yard. The station's chart helps you choose the times; it doesn't measure that particular lot.
The chart also tells you which dates to watch. High tide flooding, water covering coastal land that is normally dry, is happening more often as relative sea levels rise. An owner on a low-lying street learns those dates the way everybody else learns which morning the trash goes out.
What the chart cannot do is tell you whether a lot floods.
A tide prediction is built from the pull of the moon and the sun. It knows nothing about your elevation, your flood zone, your finished floor height, your street's drainage, or what four inches of rain does when it lands on top of a high tide.
That gap is the part worth handing to somebody who does this for a living. A good agent here will pull the flood zone and ask for the elevation certificate, check the finished floor height, and read the survey before anyone gets attached to a kitchen. The chart is free and takes a minute. The rest of the picture takes someone who has stood on enough of these lots at both ends of the swing to know which questions to ask.
Does a tide chart say anything about rip currents?
A tide chart is not a rip-current forecast. Tide stage can affect rip currents, but you also need the local beach forecast and the lifeguards' advice.
Rip currents are narrow channels of fast-moving water common along the East, Gulf, and West coasts, and they can move up to eight feet per second, faster than an Olympic swimmer. They're estimated to kill 100 people a year in the United States.
A rip tide is something else: the swift movement of tidal water through inlets and the mouths of estuaries, embayments, and harbors. The two words sound interchangeable and aren't.
Knowing the difference is part of living on a barrier island, the same way reading the chart is.
A tide chart won't tell you what a place is worth. It will tell you what a place is like.
If you're weighing a lot or a house near the water, I'd be glad to walk it with you at both ends of the swing and read the flood zone and the elevation before anyone starts talking about finishes.
Frequently asked questions
What are the current tides at Fernandina Beach, Florida, according to NOAA?
NOAA publishes them for station 8720030, its gauge at 30.671356, -81.46584, and the predictions change every day. The station's tide type is classified as Mixed.
What time is the lowest tide tonight?
No chart answers that in general, because the times shift from day to day. Pull the day's predictions for station 8720030 and read the clock time beside the lowest of the listed heights. Check the chart's datum and time zone. The station's separate datum table lists Mean Lower Low Water at 1.70 feet and Mean Higher High Water at 8.26 feet above station datum; prediction heights use a different reference, commonly Mean Lower Low Water.
What is the difference between a rip current and a rip tide?
A rip current is a narrow channel of fast-moving water that can run up to eight feet per second, faster than an Olympic swimmer. A rip tide is the swift movement of tidal water through inlets and the mouths of estuaries, embayments, and harbors. The words sound alike, and they aren't the same thing.
What are spring tides and neap tides?
Spring tides come at the full and new moon, when the Earth, sun, and moon line up nearly in a row and the average range runs slightly larger. Neap tides come about seven days later, when the sun and moon sit at right angles to each other and the range shrinks. That changes the predicted range; check the actual beach conditions before planning around exposed sand.
Can a tide chart tell you whether a lot floods?
No. A tide prediction is built from the pull of the moon and the sun, so it knows nothing about a lot's elevation, flood zone, finished floor height or street drainage. Those answers come from the flood zone, the elevation certificate and the survey.
Sources reviewed
- NOAA CO-OPS station metadata, Fernandina Beach (8720030)
- NOAA CO-OPS tidal datums, Fernandina Beach (8720030)
- NOAA CO-OPS tidal datums, Fernandina Beach (8720030)
- NOAA Ocean Service, "Tides"
- NOAA Ocean Service, "Spring and Neap Tides"
- NOAA Ocean Service, "Spring and Neap Tides"
- NOAA Ocean Service, "Rip Currents"
- NOAA Ocean Service, "Rip Currents"
- NOAA Tides & Currents, "High Tide Flooding"